WASH YOUR HANDS. STAY CALM. HELP EACH OTHER.
PRACTICE PHYSICAL DISTANCING. STAY AT HOME IF YOU CAN.
IT WILL BE OK IN THE END. IF ITS NOT OK NOW, ITS JUST NOT THE END.
This page is no longer being updated – since 31-Jan-22 case counts are no longer a reasonable tracking measure. Many regions are no longer formally tracking test results, therefore published case counts do not represent the actual cases found in the community.
If this is your first visit to this page, you might want to review some definitions, a description of this analysis, a list of the data sources, and assumptions. Otherwise…
Follow us on Twitter for updates to this page.
If you like this page, share it with your friends.
Description of Analysis, Data Sources and Assumptions
I collect numbers relating to the COVID-19 pandemic and create graphs in an attempt to visualize what is going on, and how different parts of the world are coping. Only reputable data sources are used, but the analysis is mine and the comments represent only my opinions. Feel free to disagree. Leave a comment!
A bit of terminology first:
Reported Case: this is a person who has, or had, a confirmed case of the virus. Reported case count never goes down, even when recovery (or death) happens. The only times it would go down is if there was a misdiagnosis (or a reporting error). It is simply a reported case that happened. It is absolutely true that reported cases do not represent all cases, reported cases only represent those cases that have been reported, tested, and confirmed. So its probably fair to say that reported cases are just the bad cases (and maybe also cases reported in essential/health care workers who are tested more routinely), not the mild cases where the person stayed at home to recover. However, as the testing rates increase, this number gets more and more accurate.
New Case: this is a reported case that was first reported today. The media generally presents new cases followed by reported cases. “Today there were 23 new cases for a total of 100 cases” for example.
Recovery: A reported case that has now recovered. This can mean two negative tests in twenty four hour period, or perhaps the end of a two week isolation period with no more symptoms. There does not appear to be a common definition for recovery.
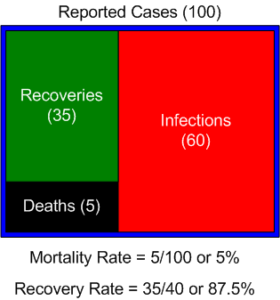
Death: A reported case that has succumbed to the illness. Unless the health care system is completely overloaded, this almost always happens in a hospital.Infection (or Active Infection): This is calculated by adding the recovery count and the death count and subtracting that total from the reported case count. For example, on a particular day if there are 100 reported cases, 35 recoveries and 5 deaths, the active infection count on that day is 100 – (35 + 5), which equals 60. The active infection count is a reasonable representation of the load on the health care system on that day. Even if there are many more unreported cases, they do not present a huge burden on the health care system because these people are likely at home recovering. Formula: Infections = Reported Cases – (Deaths + Recoveries)
Mortality Rate: this is the ratio of the number of deaths to the number of reported cases. This can be a bit misleading since there are usually a significant number of infections which have neither died nor recovered yet. The calculation of mortality rate assumes that all active infections will recover, so it tends to underestimate what the actual mortality rate will be when all reported cases have a known outcome. The mortality rate becomes more accurate as the number of cases with known outcomes grows closer to the total case count. Formula: Mortality Rate = Deaths / Reported Cases
Note: Technically what I call Mortality Rate is more correctly known as Case Mortality Rate., since it is mortality as compared to cases. However, the mainstream media calls it mortality rate, and almost everybody I discuss this with has that same definition, so I will stick with the commonly understood definition. The proper definition for mortality rate is that it compares deaths against population (not against cases) and reflects the impact on the entire population, which factors in both the rate of infection and the impact of the infection. Thanks to Cally for correcting me on this, ever so politely. 🙂
Recovery Rate: this is the ratio of the number of recoveries to the sum of recoveries and deaths. It shows, for those reported cases with a known outcome, what percentage of these cases have recovered. This will line up with mortality rate once all reported cases have a known outcome, and will get closer and closer to lining up with the mortality rate as the number of active infections drop. For example, in China in mid April (with very few active infections) the mortality rate was about 5% when the recovery rate was 94%. They were close to adding up to 100%. In the USA in mid April, (with many active infections), the recovery rate was 63% when the mortality rate was 5.3%. They were nowhere near to adding up to 100% yet. Formula: Recovery Rate = Recoveries / (Recoveries + Deaths)
The diagram below shows how reported cases are broken down into recoveries, deaths, and active infections, showing sample counts and the calculations of mortality and recovery rates.
And now some definitions about vaccines and vaccinations. I am thrilled that its time to start formulating these and tracking progress!
Vaccine: a medical compound which is intended to provide immunity to the COVID-19 virus through one or more vaccine doses.
Vaccine Dose: a single dose of a vaccine. Some vaccines require more than one dose per person, over a period of time, in order to achieve the intended immunity.
First Vaccine Dose: the first dose of a vaccine, regardless of whether subsequent doses are required. This is the key indicator of progress in a vaccination program, as it provides the initial protection to the population.
Vaccination: one or more vaccine doses (as required by the specific vaccine) which a single person receives to achieve the intended immunity of the vaccine.
Purchased Vaccination: a vaccination purchased, usually via a purchase agreement, sometimes in advance of vaccine approval, but usually in advance of vaccine availability. Some countries (like Canada) made agreement to purchase more vaccinations than their population could use, from different suppliers, since nobody could predict which supplier or which vaccine would be viable first. Since BC gets its vaccine supply as part of Canada’s purchasing arrangements, I don’t show any purchased vaccinations for BC, only scheduled, received, and injected.
Scheduled Vaccination: a purchased vaccination that is now scheduled to arrive at a certain time or over a certain period of time.
Received Vaccination: a scheduled or purchased vaccination that has been delivered by the manufacturer and received by the purchaser.
Injected Vaccination: a received vaccination that has made its way into the health system and been injected into a specific person. It might be the first vaccine dose if the specific vaccine requires more than one dose. The second or further vaccine doses, if required by the vaccine, is not counted as another injection for the purposes of tracking the delivery of vaccinations to the population of a region since it only helps one person.
Vaccinations as a percentage of population: The number of vaccinations purchased, scheduled, received, or injected in or by a region expressed as a percentage of the population of the region. Formula: Percentage of Vaccinations Purchased = Number of Purchased Vaccinations / Population of Region. In Canada for example, the percentage of vaccinations purchased is 492%. Yes, Canada made agreements to purchase enough vaccinations for about five times the population of the country. I truly hope that any unused vaccinations are shared with other regions or countries that did not, or could not, arrange to purchase in advance of availability.
Vaccination Rate: the average number of first doses injected per day in a region. This is calculated on a 14 day rolling average basis, since the reporting period varies across regions. Some regions provide updates daily, some weekly or longer, so a longer period is required to have a reasonable calculation of the rate of vaccination in that region.
Estimated Vaccination Completion: the month in which vaccinations should complete, based on the size of the remaining un-vaccinated population and the current vaccination rate. Formula: Estimated Vaccination Completion = Today + (%Population not yet vaccinated * Total Population) / Vaccination Rate
To help understand what the case count graphs represent, consider the analogy of a car:
Lets say you have a parked car that you want to race. When the car is stopped its speed and acceleration are both zero. This is like a region of the world before any COVID-19 infections have started.
When the car starts to move, the speed starts to increase, which is acceleration. This is like a region of the world where COVID-19 infections have started. The speed of the car is like the rate of new cases (measured as new cases per day).The faster the car increases speed, the greater the acceleration rate. This is like the growth of the number of new cases from one day to the next.
When the car starts to maintain a steady speed, the acceleration goes to zero but the car is still moving. This is like a region that has more or less the same number of new cases each day. There are still new cases, just not more new cases each day than the day before.
To “flatten the curve”, the car needs to slow down to a steady speed such that active infections (total reported cases less recoveries and deaths) reach a steady count that does not exceed the capacity of the health care system. This happens when that steady number of active infections does not exceed health care system capacity at the time stability is attained, or with a period of deceleration, where the speed decreases until the capacity of the health care system is no longer exceeded by the number of active infections.
Deceleration can be fast or slow. When deceleration happens in a region, the count of new cases every day begins to decrease, finally coming to near zero new cases every day. That is the goal – zero new cases each day, but the curve can be considered “flattened” when the number of active infections is stable and does not exceed the capacity of the health care system. This analysis reports the number of active infections (see Recovery charts), but does not attempt to assess if the capacity of the health care system has been exceeded.
To describe the state of some of the regions as of the end of March 2020:
- The Chinese car was slowing down and nearly stopped.
- The Italian car was nearly at its top speed, but still gaining speed.
- The USA car was accelerating rapidly, not yet at its top speed.
- The BC car was at a relatively constant speed.
- The Costa Rican car had just left the starting line.
Fairly simple to understand right?
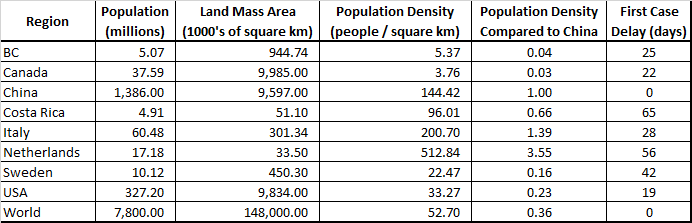
To further this analogy, imagine that the car from each region has a different size engine (horsepower). This is like the population density of each region (people per square kilometer). And we want to see the race between each region’s car and China’s car. This seems useful because China was first region to be impacted by COVID-19 and we all saw the response and its impact on the news. By comparing a region with China we can measure how that region is doing, and what might yet happen in that region. In order to make a meaningful comparison I did two things:
- I put each car on the starting line at the same time. This is done by moving the data from China forward in time to match up to the case 1 date with the particular region.
- I adjusted the horsepower of the Chinese car to match the horsepower of the regional car. This is done by scaling the reported case counts from China proportionally to the population density of the region. That is to say that China’s case counts are scaled to match the population density of each region.
OK, that was a bit more complicated, but the idea is to make the cars start at the same time, with the same size engine, then see how the regional car does against what we know already happened with the Chinese car. Its a simple idea. Not perfect, but simple.
OK, one more extension of this “car” analogy…
Imagine that there are people on the race track and each driver is trying to avoid them, but inevitably hits and injures some people. Only some people are actually injured, and those people who are injured may recover, or they may succumb to their injuries. A better driver will hit less people and will also leave behind more people that are able to recover. This is like the percentage of recoveries in those reported cases that have a known outcome, ignoring active infections (because the outcome is not known yet). A better driver (who is careful driving, and has a good health care system) will result in a higher percentage of recoveries in those cases that have a known outcome, and this provides a view as to how well the population is recovering based on known outcomes only. Only when all reported cases have a known outcome will the mortality rate for the region will line up with this.
The comments found below the graph for each region provide the speed (new cases each day), and acceleration or deceleration (change in the number of new cases each day), and rating of the driver of the car (recovery percentage of reported cases with known outcomes) and reference this “car” analogy to make it easier to understand what the numbers mean.
These are the major assumptions and formulas used in these graphs and analysis
- Formula: Adjusted_Case_1_Regional_Date = Date_of_Case_In_Region – (Case_1_Date_In_Region – Case_1_Date_In_China)
The number of days from case 1 in China to case 1 in other regions was measured. This is used to slide the China data forwards in time to align with case 1 in the region. It ranges between 19 and 65 days difference in the date of case 1.- Formula: Adjusted_China_Case_Count = ( China_Case_Count ) / ( (China_Population / China_Land_Mass) / (Regional_Population / Regional_Land_Mass) ).
Given that different regions have different population densities, which would likely impact the infection rate, The populations and land mass areas were looked up to create population density numbers (people per square km). Population density ratios between China and other regions are calculated and used that to scale the Chinese data down in a linear fashion. This is a major simplifying assumption which undoubtedly introduces error, but I believe it brings the analysis closer to the truth than simply ignoring population density.Google was used to find populations and land masses.- Different data sets are reported in different time zones so the data may be off by a day or so in some cases.
I chose a particular set of regions to analyze:
- China – as the starting point for this virus and the first worldwide experience of this outbreak. China seemed like a good region to compare to.
- Canada and BC – because I live in BC, which is a province of Canada
- Netherlands – because I have family there
- Costa Rica – because I have family there too
- Italy – because of the tremendous impact this is having there
- USA – because anything of this scale happening in the USA will undoubtedly impact the rest of the world
- Sweden – because they are less strict about locking down, depending on their people to take the right measures without needing the enforcement.
- World – because its the whole world!
Only reputable data sources are used as listed below.
- World Health Organization – for Case and Death counts in China and the world. Updated with a situation report once per day. I note that the Canada numbers reported here are a day or two behind Canada CDC and are likely a day or two behind most areas of the world because it takes time to collect and report. There was a jump in reported cases mid February which reflects a change in the way the WHO collected and reported data.
- Canadian Public Health – for Case and Death counts in Canada. Updated several times per day.
- CTV News – for verification against Canada Public Health and for Canadian recovery data.
- USA Center for Disease Control – for Case and Death counts in USA. This site is updated every weekday, but not always on weekends, which seems strange to me.
- British Columbia Center for Disease Control – for Case, Death, and Recovery counts in BC. Updated several times a day.
- RIVM Netherlands for Case and Death counts in the Netherlands.
- Johns Hopkins GIS App for recovery counts if I cannot find them on region specific CDC sites
- World Odometer for recovery counts if I can’t find them elsewhere.
- CTV News has established a vaccination tracking website for Canada.
Since some of these sites do not publish their own historical data, and since I only started collecting systematically in early March, I used the Way Back web site to collect some of the historical data. Not every day was captured by Way Back so there are some gaps in the data which make some of the graphs a bit “choppy” in January and February, but I did get historical data at least weekly using that approach.
The following data has been used to display or adjust the regional data in order to show it per capita.
The following charts and analysis are created on this basis. They are updated once a day (usually in the evening Pacific Daylight Time) and published weekly.
Quick Links
31-Jan-22 *New Today*
- No further analyses will be published due to the fact that many regions are no longer formally tracking test results, making an accurate assessment of case counts in our communities impossible. Thanks for your interest over the last two years.
Today's Numbers
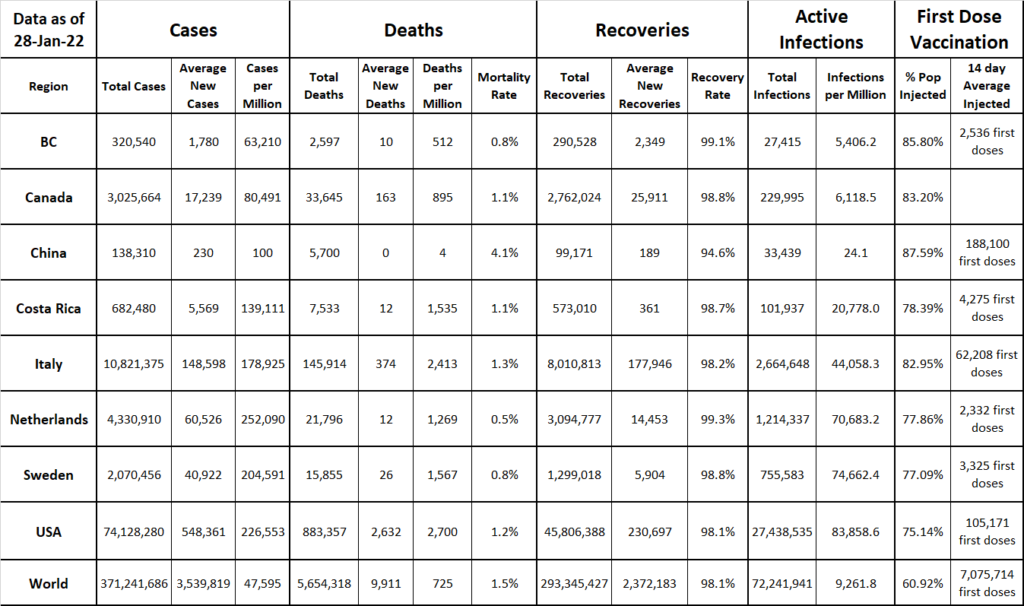
Comments on Today’s Numbers
- Johns Hopkins stopped reporting all recoveries on 12-May-21. Netherlands recovery numbers were very low per reported case compared to other regions, but World Odometer numbers look more reasonable. Therefore the active infection line for the Netherlands followed the case count line very closely up to 12-May. Swedish recovery numbers are reported on World Odometer, so the active infection and recovery curves have been added again. BC CDC and Canada Public Health publishes BC and Canadian recovery data respectively.
- CTV News Vaccine tracker changed vaccination reporting on 31-May-21. There is better first dose information for regions outside of Canada. This has impacted the regional vaccination graph.
- Daily case counts are likely under-reported as of January 2022 as a result of changing test strategies due to the explosion of the Omicron variant and likely represent only the more serious cases. The trend is still significant (going up or down), but likely the absolute numbers are not representative of the true number of cases.
- Some metrics on the numbers: As of 28-Jan-22, over the period from 03-Jan-20 to 28-Jan-22 (757 days), there have been 27,719 individual numbers collected for 9 regions, which are used to form these graphs and analysis. The main Excel spreadsheet has 111 columns of calculations across 6,521 rows of data, making 723,831 individual calculations. There are fourteen Visual Basic functions and seventeen worksheets in the spreadsheet. Each day forty-one new numbers are collected and verified from eight independent web sites. It takes four CPUs and 6.6 minutes for the spreadsheet to grind out the graphs and analysis. Some manual written analysis is created and entered. Then it takes about twenty minutes to copy and paste the results to my website. This is not a funded service and is free from any political interference. Just saying…
First Dose Vaccination Status - All Regions
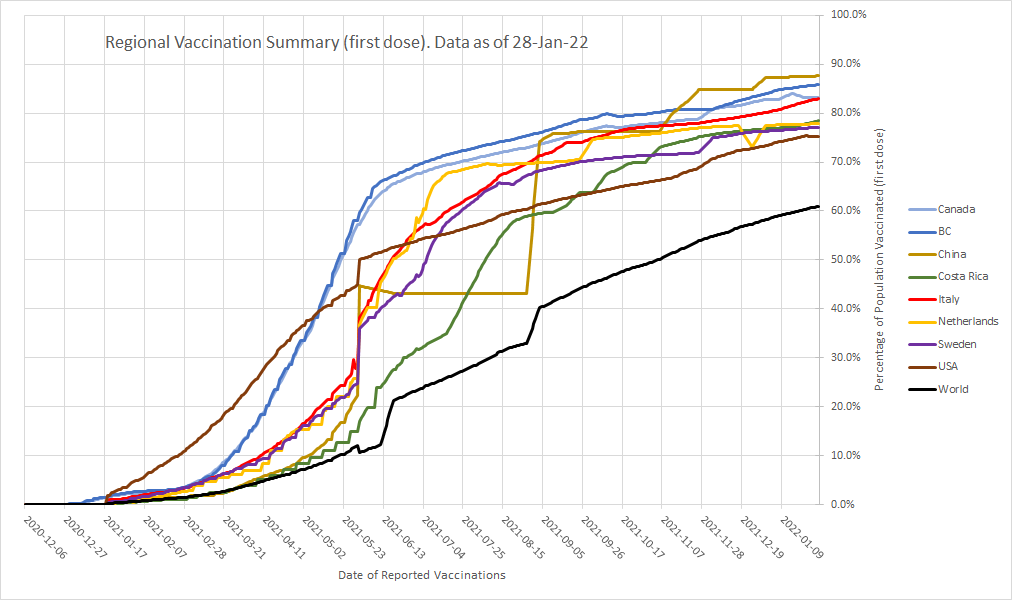
28-Jan-22 Comment: Over the analyzed regions, China is leading in first vaccinations per capita. The world as a whole is finally picking up speed. First dose vaccinations are slowing as the focus shifts to second doses. The large changes at the end of May 2021 are as a result of improvements in published vaccination data. Data Source: CTV News Vaccination Tracker
First Dose Vaccination Rate - All Regions

03-Sep-21 Comment: This graph shows the rate of first dose vaccinations over time (on a 14 day rolling average). Most regions are slowing their rate of first vaccinations as the focus is shifting to second vaccinations. The large changes at the end of May are as a result of improvements in published vaccination data. Data Source: CTV News Vaccination Tracker
First Dose Vaccination Status - Canada and BC
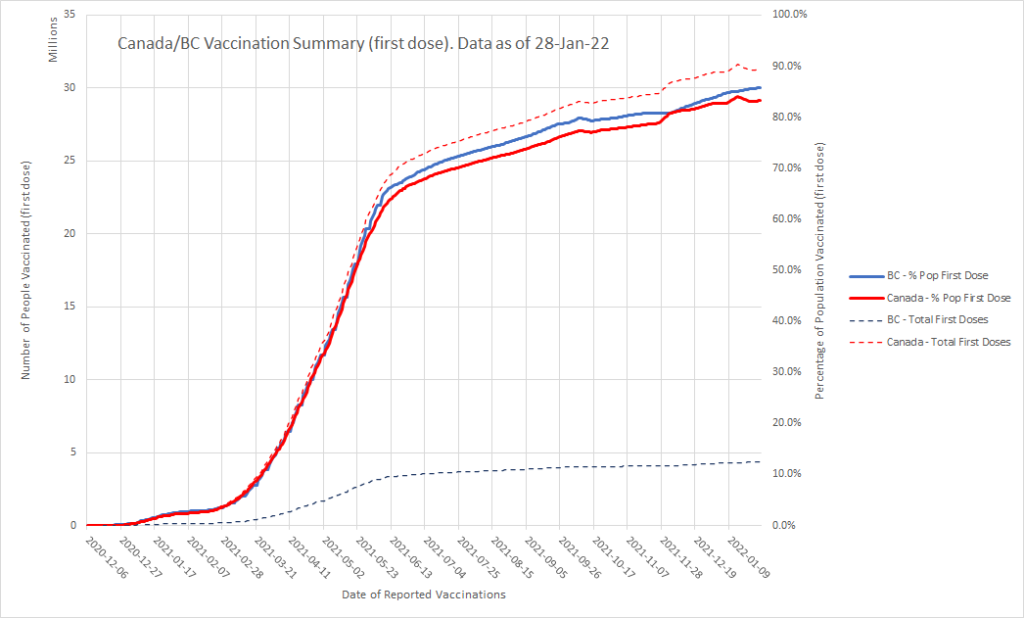
28-Jan-22 Comment: Canada has received a total of 46,421,352 vaccinations (123.5% of the population), has injected a total of 31,274,880 first vaccination doses (83.2% of the population), at an average rate of first doses per day. Canada has agreements with seven vaccine manufacturers. There were plans for 600,000 vaccinations to be to be available by end of March 2021. Canada beat that schedule by a wide margin, achieving nearly 5 million first doses.
28-Jan-22 Comment: BC has received a total of 5,952,065 vaccinations (117.4% of the population), has injected a total of 4,350,918 first vaccination doses (85.8% of the population), at an average rate of 2,536 first doses per day, with an estimated completion in November 2022. In total 400,000 people were to be vaccinated by the end of March 2021, BC beat that schedule by a wide margin, achieving nearly 680,000 first doses. There was a sharp increase of injections late February 2021 as vaccine deliveries stepped up again.
Data Sources: CTV News and CBC News (links are below in the Vaccination Milestones section, and definitions are above in the Definitions section).
Vaccination Milestones
Fall 2020: Canada arranges to purchase 214 million doses (for 107 million people) from seven suppliers. Source: CTV News.
07-Dec-20: Canada does a trial run of deliveries of vaccines in anticipation of the delivery of 250,000 doses (for 125,000 people) expected next week shipped to direct to fourteen distribution centers across the country. Source: CTV News
08-Dec-20: First Pfizer vaccination on a non-trial basis happened in the UK. Source: CTV News.
09-Dec-20: BC is expecting 4,000 Pfizer doses (enough for 2000 people) by mid December. Source: BC CTV News. Canada unveils its Immunization Plan where they expect three million Canadians to be vaccinated by and of March 2021.
10-Dec-20: BC is expecting 40,000 Pfizer doses (enough for 20,000 people) of the 250,000 doses that Canada announced on 7-Dec, to be delivered by the end of December. Source: BC CTV News
11-Dec-20: BC is expecting to have 400,000 people vaccinated by end of March 2021. Source: CBC News
14-Dec-20: BC has received enough Pfizer vaccine for 2,000 people. Source: CBC News. Canada has received enough Pfizer vaccine for 15,000 people. Source: Aerotime News . The first vaccination in Canada was injected today.
15-Dec-20: BC injects first dose of Pfizer. Source: CBC News. Canada confirms 168,000 Moderna doses (84,000 vaccinations) to arrive before end of year and an additional 1,000,000 Pfizer doses (500,000 vaccinations) to arrive before the end of year. Source: CTV News.
16-Dec-20: Canada announces that all Canadians who want a vaccination will be vaccinated by September 2021. Source: CBC News. BC has injected 407 people so far. Source: CBC News
17-Dec-20: BC has injected 1,215 people so far. Source: Tri City News
18-Dec-20: Canada announces 125,000 doses (72,500 people) every week, with 500,000 doses (250,000 people) by end of January. Source: Global News. BC has vaccinated 2,592 people. Source: Global News.
21-Dec-20: Canada gets closer to approving Moderna vaccine. Source: Global News.
22-Dec-20: 4,108 people vaccinated in BC. Source: Global News.
23-Dec-20: 5.603 people vaccinated in BC. Expecting 792,000 to be vaccinated by end of March. Source: CBC News. Canada approves Moderna vaccine. Canada expects to have 1.2 million doses (600,000 people) by end of January. Source: CBC News.
27-Dec-20: BC identifies first UK variant on Vancouver Island. Source: CBC News.
29-Dec-20: BC has administered 11,930 vaccinations. Source: CBC News.
30-Dec-20: Canadian vaccinations are being tracked by CTV. Source: CTV News.
22-Jan-21: BC unveils its immunization strategy. Source: CBC News
01-Mar-21: BC enters phase 2 in the vaccination plan. Source: CTV News
15-Mar-21: BC allows outdoor gatherings up to 10 people.
30-Mar-21: BC imposes tighter restrictions due to climbing case counts, closes Whistler/Blackcomb
1-Nov-21: USA approves Pfizer vaccination for ages 5-11. Under consideration in Canada.
5-Nov-21: Pfizer and Merck announce antiviral pills to be used in the first few days of sickness or hospitalization.
23-Nov-21: Canada approves vaccinations for ages 5-11.
Cases in all Regions
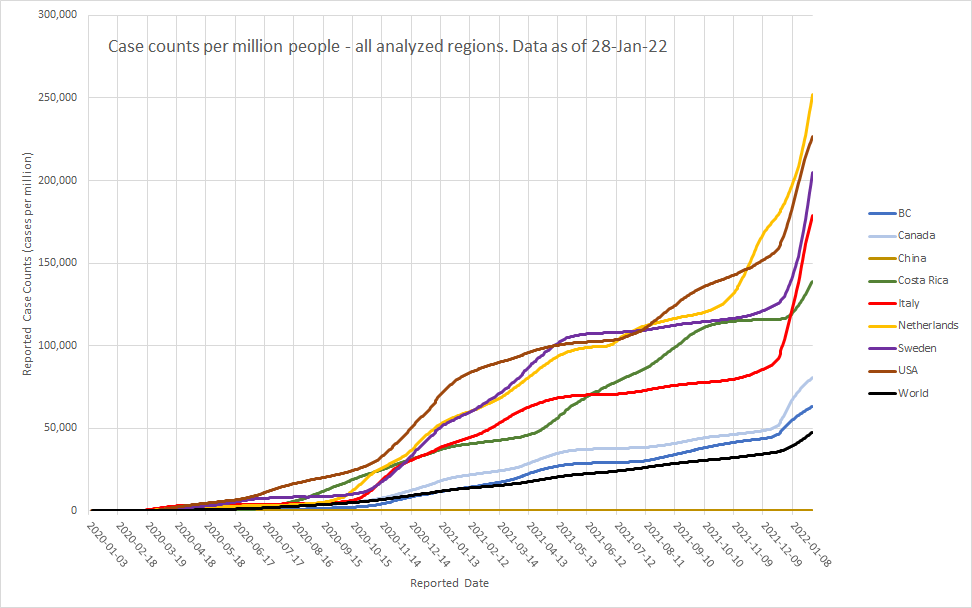
28-Jan-22 Comment: Most regions are experiencing an explosive rise in case counts. USA is catching up to Netherlands. China is well below the World average. China’s total case count is lower than any other analyzed region, and is extremely low per capita compared to other regions. Data Sources: WHO, Johns Hopkins, Canada Public Health, CTV News, BC CDC.
Deaths in all Regions
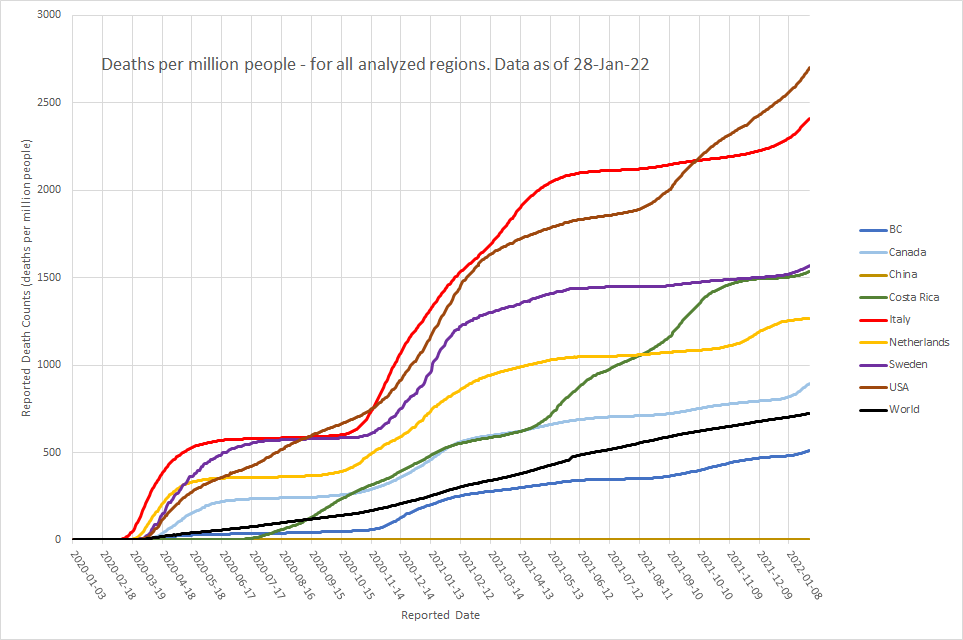
21-Jan-22 Comment: USA reports the most deaths per capita in analyzed regions. Costa Rica and Netherlands are noticeably slowing, but the impact of Omicron has not been felt in most regions yet. BC and China are below the World average. Mortality rate (deaths per reported cases) for analyzed regions ranges from 0.5% in Netherlands to 4.1% in China. Recovery rate (recoveries per reported cases with known outcomes) for analyzed regions ranges from 95% in China to 99.3% in Netherlands. Data Sources: WHO, Johns Hopkins, Canada Health, BC CDC, USA CDC.
Tests

06-Aug-21 Comment: BC has performed 3,205,006 tests (63.2% of the population). Canada has performed 38,835,828 tests (103.3% of the population). The USA has performed 509,684,911 tests (155.8% of the population). The USA has tested at a much higher rate than both Canada and BC. BC is testing at just about two-thirds the rate of Canada as a whole. Data Sources: Johns Hopkins, Canada Public Health, BC CDC.
World Case Counts
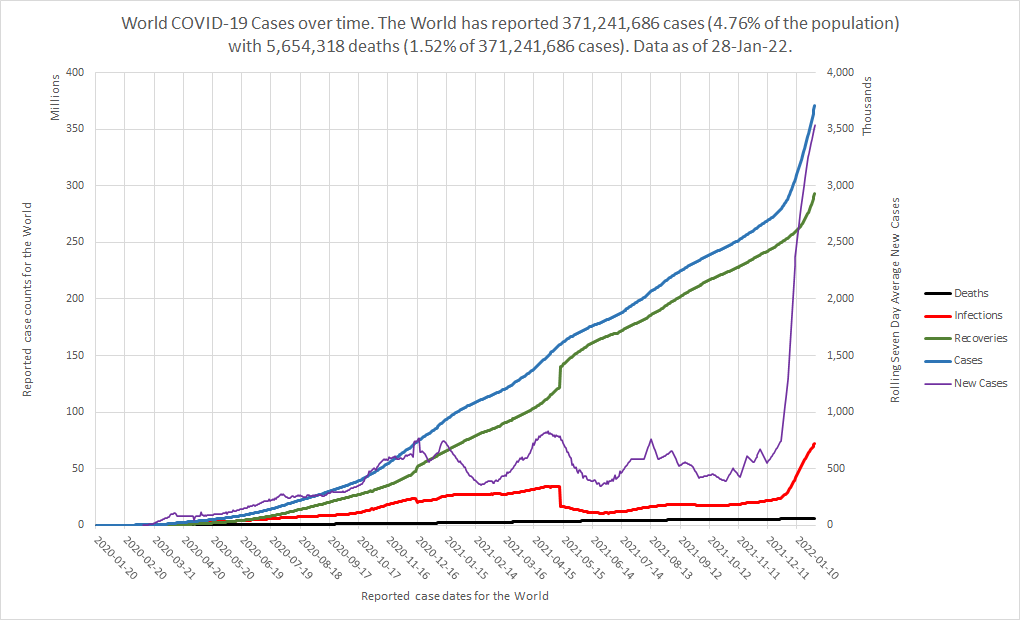
28-Jan-22 Comment: The World reported a total of 371,241,686 cases. The number of new cases is extremely high over the last 7 days (an average of 3,539,819 new cases per day). In the last 7 days, the speed of the World’s car is extremely high. In the World the number of active infections is increasing extremely rapidly over the last 7 days (an average increase of 1,157,725 active infections each day), with a current total of 72,241,941 active infections. The World reported a total of 5,654,318 deaths. The mortality rate in the World is 1.5%. Based on recoveries vs deaths (98%) so far, the driver of this car is a very good driver. The World reported the highest daily (7 day average) number of new cases (3,539,819) today on 28-Jan-22, the highest active infection count (72,241,941) today on 28-Jan-22, and the highest daily deaths (40,538) 7.9 months ago on 04-Jun-21. The fifth wave is quite obvious at the world level and has exceeded the daily case count of all prior waves. Data Sources: Johns Hopkins/World Odometer recoveries.
China Case Counts
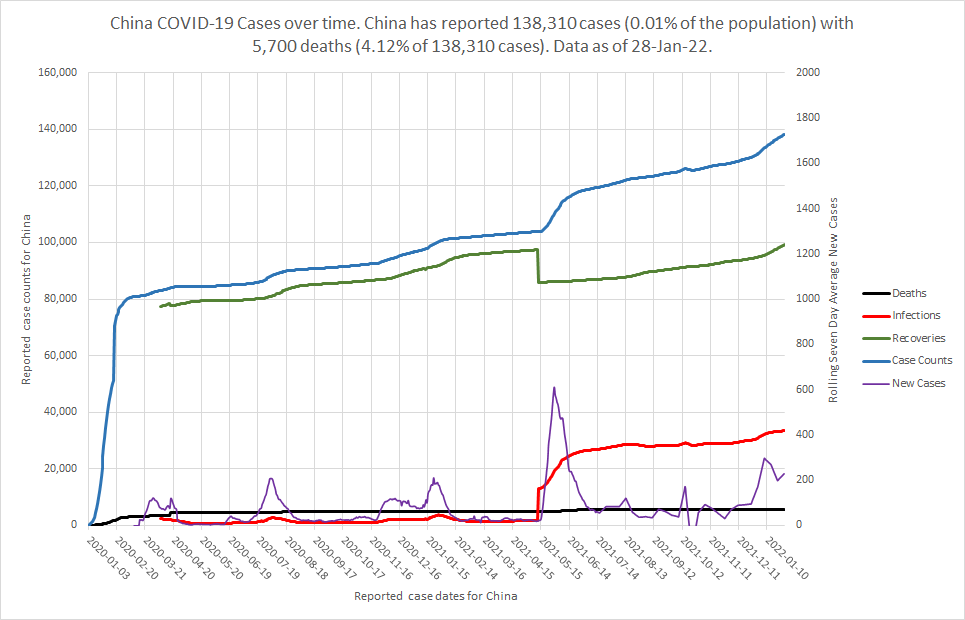
28-Jan-22 Comment: China reported a total of 138,310 cases. The number of new cases is almost stopped over the last 7 days (an average of 230 new cases per day). In the last 7 days, the speed of China’s car is almost stopped. In China the number of active infections is constant over the last 7 days (an average increase of 41 active infections each day), with a current total of 33,439 active infections. China reported a total of 5,700 deaths. The mortality rate in China is 4.1%. Based on recoveries vs deaths (95%) so far, the driver of this car is a poor driver. China reports zero times the world per capita case count, 0.01 times the world per capita death count, and zero times the world per capita active infection count. China reported the highest daily (7 day average) number of new cases (743) 8.3 months ago on 23-May-21, the highest active infection count (33,439) today on 28-Jan-22, and the highest daily deaths (1,290) 1.8 years ago on 17-Apr-20. Overall China is recovering well, with much lower case counts per capita than all other analyzed regions, but is definitely experiencing an Omicron spike in cases. 注意安全 Data Sources: WHO / World Odometer recoveries.
Netherlands Case Counts
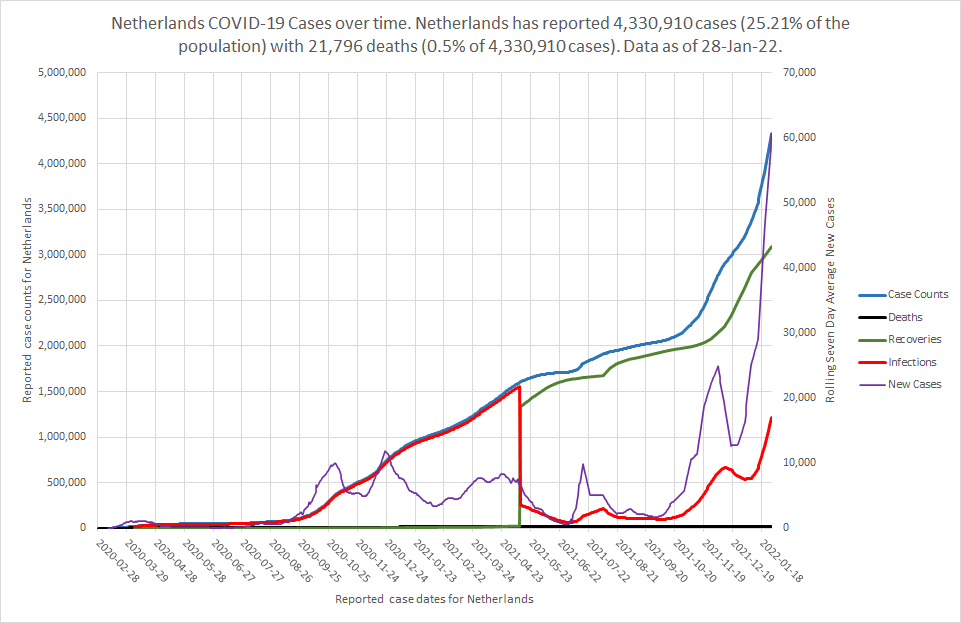
28-Jan-22 Comment: Netherlands reported a total of 4,330,910 cases. The number of new cases is extremely high over the last 7 days (an average of 60,526 new cases per day). In the last 7 days, the speed of Netherlands’s car is extremely high. In Netherlands the number of active infections is increasing extremely rapidly over the last 7 days (an average increase of 46,061 active infections each day), with a current total of 1,214,337 active infections. Netherlands reported a total of 21,796 deaths. The mortality rate in Netherlands is 0.5%. Based on recoveries vs deaths (99%) so far, the driver of this car is an excellent driver. Netherlands reports 5.3 times the world per capita case count, 1.8 times the world per capita death count, and 7.6 times the world per capita active infection count. Netherlands reported the highest daily (7 day average) number of new cases (60,527) yesterday on 27-Jan-22, the highest active infection count (1,554,305) 8.7 months ago on 11-May-21, and the highest daily deaths (241) 1.8 years ago on 07-Apr-20. The fifth wave is quite obvious and has passed all prior waves in daily case counts. Blijf Veilig! Data Source: Johns Hopkins/World Odometer recoveries.
Italy Case Counts
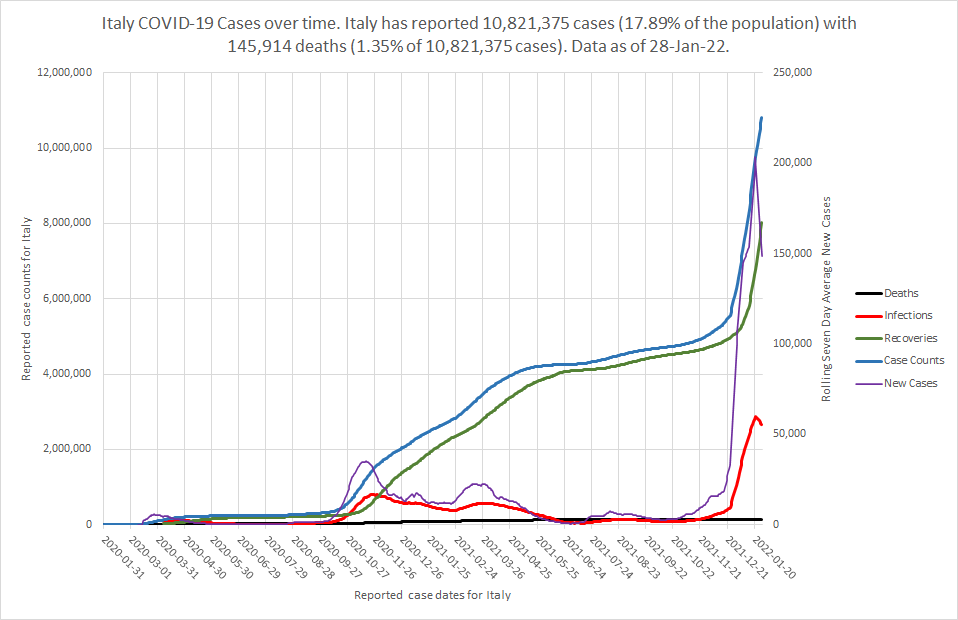
28-Jan-22 Comment: Italy reported a total of 10,821,375 cases. The number of new cases is extremely high over the last 7 days (an average of 148,598 new cases per day). In the last 7 days, the speed of Italy’s car is extremely high. In Italy the number of active infections is decreasing very rapidly over the last 7 days (an average decrease of 29,722 active infections each day), with a current total of 2,664,648 active infections. Italy reported a total of 145,914 deaths. The mortality rate in Italy is 1.3%. Based on recoveries vs deaths (98%) so far, the driver of this car is a very good driver. Italy reports 3.8 times the world per capita case count, 3.3 times the world per capita death count, and 4.8 times the world per capita active infection count. Italy reported the highest daily (7 day average) number of new cases (203,526) 8 days ago on 20-Jan-22, the highest active infection count (2,872,705) 7 days ago on 21-Jan-22, and the highest daily deaths (1,056) 1.8 years ago on 06-Apr-20. Another explosive wave is underway, but slowing. Rimanga sicuro! Data Source: Johns Hopkins/World Odometer recoveries.
Sweden Case Counts
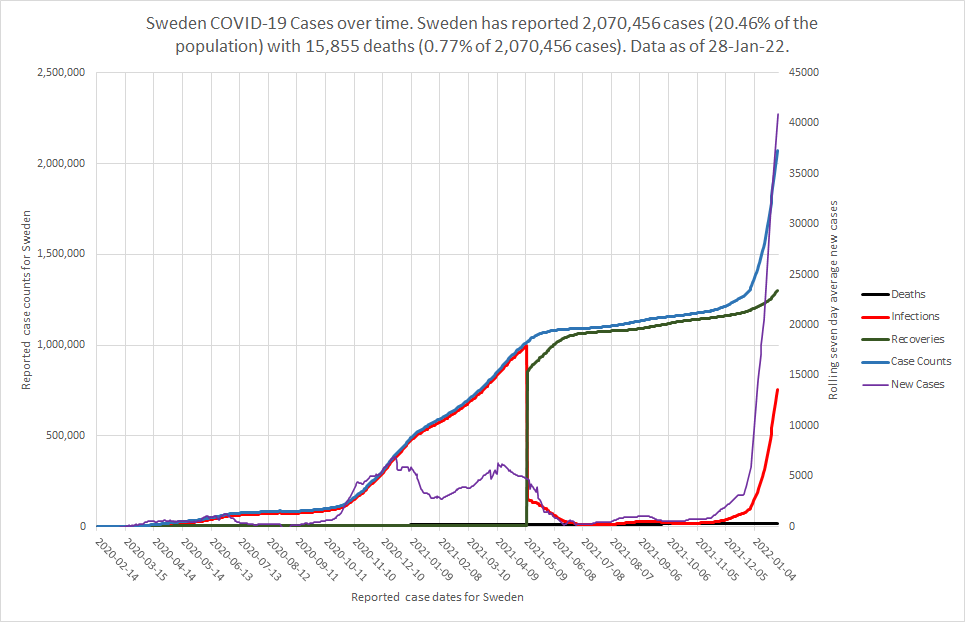
28-Jan-22 Comment: Sweden reported a total of 2,070,456 cases. The number of new cases is extremely high over the last 7 days (an average of 40,922 new cases per day). In the last 7 days, the speed of Sweden’s car is extremely high. In Sweden the number of active infections is increasing extremely rapidly over the last 7 days (an average increase of 34,991 active infections each day), with a current total of 755,583 active infections. Sweden reported a total of 15,855 deaths. The mortality rate in Sweden is 0.8%. Based on recoveries vs deaths (99%) so far, the driver of this car is an excellent driver. Sweden reports 4.3 times the world per capita case count, 2.2 times the world per capita death count, and 8.1 times the world per capita active infection count. Sweden reported the highest daily (7 day average) number of new cases (40,922) today on 28-Jan-22, the highest active infection count (995,532) 8.8 months ago on 09-May-21, and the highest daily deaths (351) 1 year ago on 14-Jan-21. Sweden’s response, with limited economic closures, is intended to result in little or no second wave of infections. Clearly this failed as the second, third, and small fourth waves are quite obvious, and an explosive fifth wave is underway. Var försiktig! Data Source: Johns Hopkins/World Odometer recoveries.
Costa Rica Case Counts
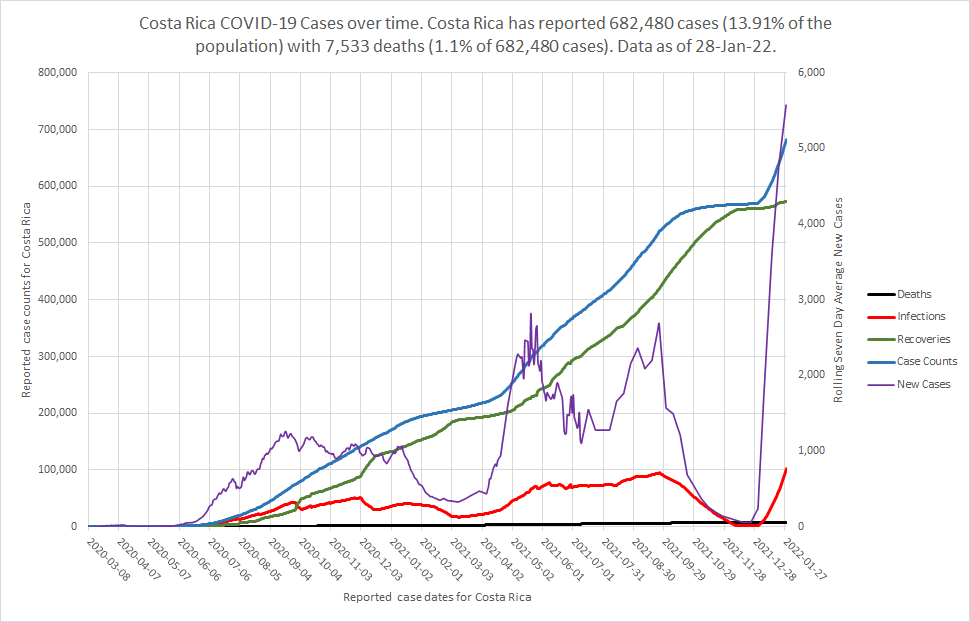
28-Jan-22 Comment: Costa Rica reported a total of 682,480 cases. The number of new cases is extremely high over the last 7 days (an average of 5,569 new cases per day). In the last 7 days, the speed of Costa Rica’s car is extremely high. In Costa Rica the number of active infections is increasing extremely rapidly over the last 7 days (an average increase of 5,196 active infections each day), with a current total of 101,937 active infections. Costa Rica reported a total of 7,533 deaths. The mortality rate in Costa Rica is 1.1%. Based on recoveries vs deaths (99%) so far, the driver of this car is an excellent driver. Costa Rica reports 2.9 times the world per capita case count, 2.1 times the world per capita death count, and 2.2 times the world per capita active infection count. Costa Rica reported the highest daily (7 day average) number of new cases (5,854) 8.6 months ago on 14-May-21, the highest active infection count (101,937) today on 28-Jan-22, and the highest daily deaths (65) 8.6 months ago on 14-May-21. An explosive growth in new cases is underway. ¡Mantenerse a salvo! Data Source: Johns Hopkins/World Odometer recoveries.
USA Case Counts
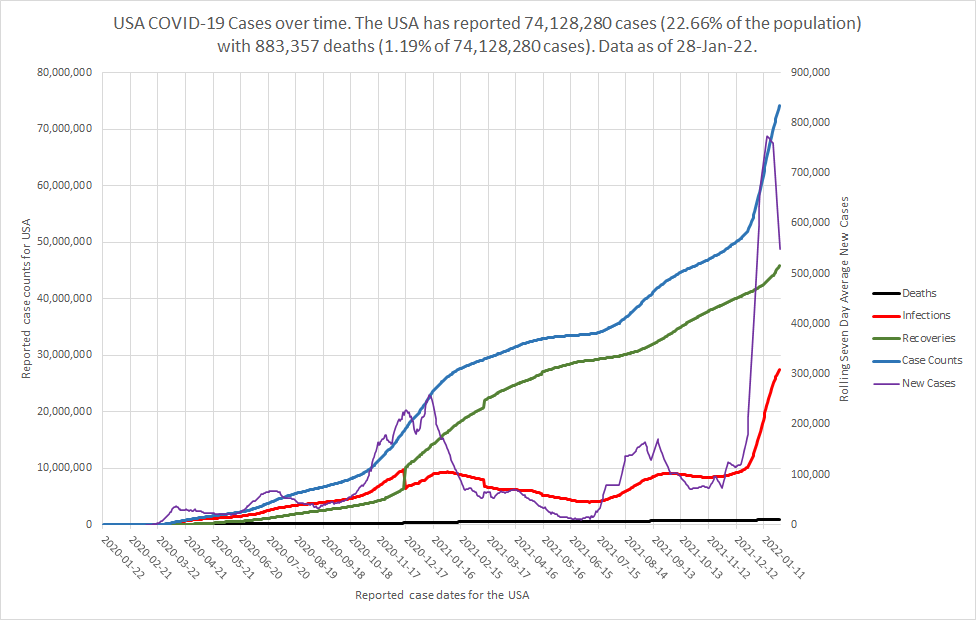
28-Jan-22 Comment: The USA reported a total of 74,128,280 cases. The number of new cases is extremely high over the last 7 days (an average of 548,361 new cases per day). In the last 7 days, the speed of the USA’s car is extremely high. In the USA the number of active infections is increasing extremely rapidly over the last 7 days (an average increase of 315,033 active infections each day), with a current total of 27,438,535 active infections. The USA reported a total of 883,357 deaths. The mortality rate in the USA is 1.2%. Based on recoveries vs deaths (98%) so far, the driver of this car is a very good driver. The USA reports 4.8 times the world per capita case count, 3.7 times the world per capita death count, and 9.0 times the world per capita active infection count. The USA reported the highest daily (7 day average) number of new cases (773,887) 2 weeks ago on 14-Jan-22, the highest active infection count (27,438,535) today on 28-Jan-22, and the highest daily deaths (5,346) 11.7 months ago on 12-Feb-21. An explosive wave is underway. Stay safe! Data Sources: Johns Hopkins/World Odometer recoveries.
Canada Case Counts
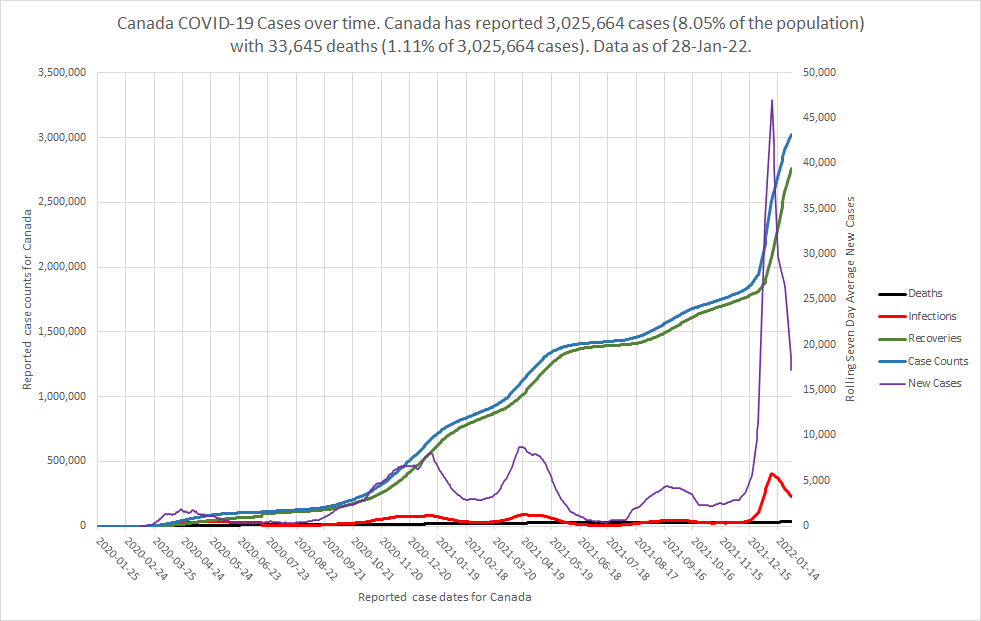
28-Jan-22 Comment: Canada reported a total of 3,025,664 cases. The number of new cases is extremely high over the last 7 days (an average of 17,239 new cases per day). In the last 7 days, the speed of Canada’s car is extremely high. In Canada the number of active infections is decreasing very rapidly over the last 7 days (an average decrease of 8,835 active infections each day), with a current total of 229,995 active infections. Canada reported a total of 33,645 deaths. The mortality rate in Canada is 1.1%. Based on recoveries vs deaths (99%) so far, the driver of this car is an excellent driver. Canada reports 1.7 times the world per capita case count, 1.2 times the world per capita death count, and 0.7 times the world per capita active infection count. Canada reported the highest daily (7 day average) number of new cases (47,008) 3.4 weeks ago on 04-Jan-22, the highest active infection count (406,497) 3 weeks ago on 07-Jan-22, and the highest daily deaths (289) 1.7 years ago on 08-May-20. An explosive wave is underway, but showing signs of slowing. Stay safe! Data Source: Canada Public Health.
BC Case Counts
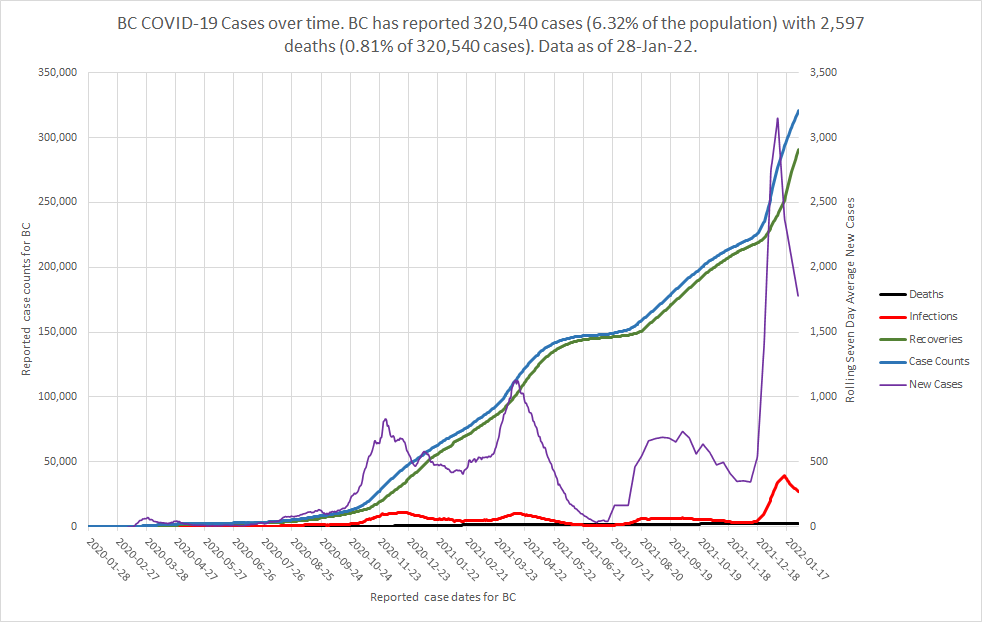
28-Jan-22 Comment: BC reported a total of 320,540 cases. The number of new cases is extremely high over the last 7 days (an average of 1,780 new cases per day). In the last 7 days, the speed of BC’s car is extremely high. In BC the number of active infections is decreasing very rapidly over the last 7 days (an average decrease of 579 active infections each day), with a current total of 27,415 active infections. BC reported a total of 2,597 deaths. The mortality rate in BC is 0.8%. Based on recoveries vs deaths (99%) so far, the driver of this car is an excellent driver. BC reports 1.3 times the world per capita case count, 0.7 times the world per capita death count, and 0.6 times the world per capita active infection count. BC reported the highest daily (7 day average) number of new cases (3,147) 3 weeks ago on 07-Jan-22, the highest active infection count (39,207) 2 weeks ago on 14-Jan-22, and the highest daily deaths (28) 1.1 years ago on 19-Dec-20. An explosive wave is underway, but showing early signs of slowing. Stay vigilant and stay safe! We are not done yet. Data Source: BC CDC.
This Post Has 1,019 Comments
Leave a Reply Cancel reply
You must be logged in to post a comment.
There’s certainly a lot to know about this topic. I like all of the points you have made.
This was an awesome blog post. I really liked it. I’ll return to read some more. Thank you .
I like this web site because so much utile material on here :
D.
It’s nearly impossible to find experienced people about this subject, however, you sound like you know what you’re talking about! Thanks
Thank you for sharing your info. I truly appreciate your efforts and I will be waiting for your next post thanks once again.|
I have to thank you for the efforts you’ve put in writing this website. I really hope to check out the same high-grade content by you later on as well. In truth, your creative writing abilities has encouraged me to get my own, personal website now 😉
It’s awesome to visit this site and reading the views of all colleagues concerning this paragraph, while I am also keen of getting experience.|
This website was… how do I say it? Relevant!! Finally I’ve
found something that helped me. Kudos!
This is a good tip particularly to those new to the blogosphere. Brief but very precise info… Appreciate your sharing this one. A must read article!
Normally I do not learn post on blogs, but I would like to say that this write-up very compelled me to take a look at and do it! Your writing style has been surprised me. Thank you, quite great post.|
What’s up colleagues, how is everything, and what you want to say regarding this piece of writing, in my view its in fact awesome for me.|
I will right away grab your rss as I can not find your
e-mail subscription link or e-newsletter service. Do you have any?
Kindly allow me recognise so that I could subscribe. Thanks.
It’s hard to find educated people in this particular topic, however, you sound like you know what you’re talking about! Thanks
I want to to thank you for this fantastic read!! I absolutely loved every bit of it. I have you saved as a favorite to check out new things you post…
I quite like reading through an article that can make people think. Also, many thanks for allowing for me to comment!|
Hello There. I found your blog the usage of msn. That is an extremely smartly written article. I’ll make sure to bookmark it and return to read extra of your useful info. Thanks for the post. I’ll certainly comeback.
Saved as a favorite, I really like your blog!|
If you are going for best contents like I do, only pay a quick visit this web page all the time since it provides feature contents, thanks|
Saved as a favorite, I like your website!
Admiring the time and effort you put into your site and in depth information you provide. It’s great to come across a blog every once in a while that isn’t the same unwanted rehashed information. Great read! I’ve bookmarked your site and I’m including your RSS feeds to my Google account.
Can I just say what a relief to discover an individual who truly understands what they are talking about online. You actually realize how to bring a problem to light and make it important. A lot more people need to check this out and understand this side of your story. I was surprised you aren’t more popular since you certainly possess the gift.
I couldn’t refrain from commenting. Very well written.
It’s a shame you don’t have a donate button! I’d without a doubt donate to this excellent blog! I suppose for now i’ll settle for bookmarking and adding your RSS feed to my Google account. I look forward to fresh updates and will share this blog with my Facebook group. Chat soon!
This was an awesome piece of content. I really liked it. I’ll return to view more. Thank you !
Thank you for sharing your info. I truly appreciate your efforts and I am waiting for your next post thank you once again.|
Pretty! This was an incredibly wonderful article. Many thanks for providing these details.
Everything is very open with a very clear description of the issues. It was definitely informative. Your site is very useful. Thank you for sharing!
Way cool! Some extremely valid points! I appreciate you writing this post plus the rest of the website is also very good.
Everything is very open with a really clear explanation of the challenges. It was definitely informative. Your site is extremely helpful. Thank you for sharing!
This post gives clear idea designed for the new people of blogging, that genuinely how to do blogging.|
Aw, this was an exceptionally nice post. Spending some time and actual effort to make a very good article… but what can I say… I hesitate a lot and never seem to get anything done.
Your style is unique in comparison to other people I’ve read stuff from. I appreciate you for posting when you have the opportunity, Guess I will just bookmark this site.
Great post! We will be linking to this particularly great content on our website. Keep up the good writing.
You’re so interesting! I don’t believe I’ve read through anything like that before. So good to find another person with genuine thoughts on this subject matter. Really.. thank you for starting this up. This website is something that’s needed on the web, someone with a bit of originality!
I need to to thank you for this very good read!! I certainly loved every little bit of it. I have got you bookmarked to look at new things you post…
It’s actually a nice and useful piece of info. I am happy that you just shared this useful information with us. Please keep us informed like this. Thanks for sharing.|
Can I simply just say what a comfort to find someone that truly knows what they are discussing on the net. You definitely realize how to bring a problem to light and make it important. A lot more people have to look at this and understand this side of the story. I was surprised that you aren’t more popular given that you most certainly have the gift.
I will immediately take hold of your rss feed as I can not find your
email subscription hyperlink or e-newsletter service.
Do you’ve any? Kindly allow me know in order that I may subscribe.
Thanks.
Good website! I truly love how it is simple on my eyes and the data are well written. I’m wondering how I might be notified when a new post has been made. I’ve subscribed to your RSS feed which must do the trick! Have a nice day!
Hey there! I could have sworn I’ve been to this website before but after browsing through some of the post I realized it’s new to me. Anyways, I’m definitely delighted I found it and I’ll be bookmarking and checking back often!|
Do you mind if I quote a couple of your posts as long as I provide credit and sources back to your site? My blog is in the exact same niche as yours and my users would truly benefit from a lot of the information you present here. Please let me know if this ok with you. Cheers!|
I love it when folks come together and share opinions. Great blog, keep it up!|
This website was… how do I say it? Relevant!! Finally I’ve found something that helped me. Many thanks!
Wow, this post is good, my younger sister is analyzing these things, thus I am going to convey her.|
Valuable info. Lucky me I found your website by accident, and I am shocked why this accident didn’t happened earlier! I bookmarked it.
Having read this I believed it was extremely informative. I appreciate you finding the time and energy to put this informative article together. I once again find myself spending a lot of time both reading and commenting. But so what, it was still worthwhile.
This page certainly has all of the info I needed about this subject and didn’t know who to ask.
I really like reading a post that will make men and women think. Also, many thanks for allowing me to comment!
I am extremely impressed with your writing skills as well as with the layout on your blog. Is this a paid theme or did you customize it yourself? Either way keep up the nice quality writing, it’s rare to see a great blog like this one nowadays.|
I’m amazed, I have to admit. Seldom do I come across a blog that’s equally educative and engaging, and without a doubt, you have hit the nail on the head. The issue is something that not enough people are speaking intelligently about. Now i’m very happy I came across this in my hunt for something concerning this.|